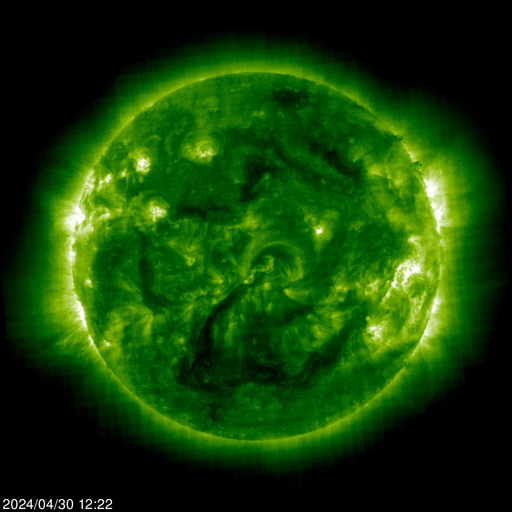
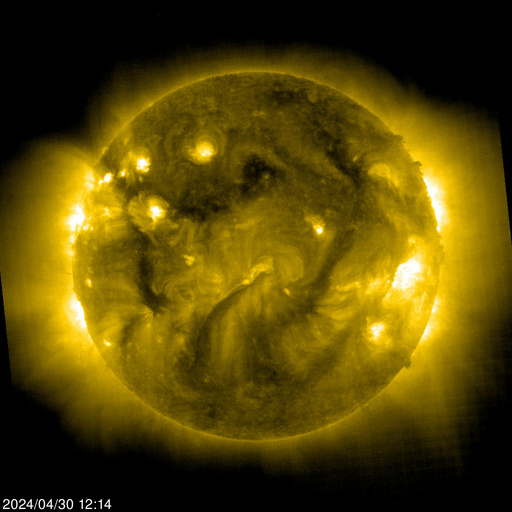
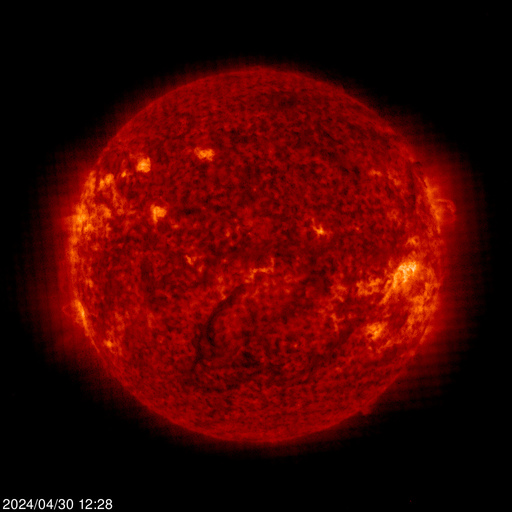
Other charts of solar activity:
More information:www.solen.info


 Radar Status Message from NWS
Radar images from NWS
Radar Status Message from NWS
Radar images from NWS

| Convective/Tropical Weather | Flooding | Winter Weather | Non-Precipitation |
| Tornado Watch Tornado Warning* Severe Thunderstorm Watch Severe Thunderstorm Warning* Hurricane Watch Hurricane Warning Tropical Storm Watch Tropical Storm Warning |
Flash Flood Watch Flash Flood Warning* Coastal/Flood Watch Coastal/Flood Warning Small Stream Flood Advisory |
Blizzard Warning Winter Storm Watch Winter Storm Warning Snow Advisory Freezing Rain Advisory Ice Storm Warning Winter Weather Advisory |
High Wind Warning or Advisory |

The Schumann Resonances Power graph summarizes the information presented in the Spectrogram Calendar and illustrates the dynamic changes occurring in the Schumann Resonances region of the magnetic field. Power is the sum of the power in all frequencies detected by the site magnetometer from 0.32 to 36 Hertz and is calculated for every hour. A 24-hour moving average of this power data is plotted for each site and updated hourly.

Each monitoring site is represented by a separate colored line and can be toggled on or off by clicking the label for each site in the legend key. The time span of data displayed can be changed with the Zoom control in the upper left of the chart window or with the horizontal slider and range display controls under the time and date labels.