Showing posts with label earth. Show all posts

Southeastern Florida Radar Loop

Radar Status Message from NWS   Radar images from NWS

The WSR-88D radar used here is located near Miami, FL (AMX on the map), and the images are generated from raw Level 2 data using only the lowest scan elevation available (typically 0.5°). Images are updated every 4-10 minutes, depending on the radar's scanning mode (VCP). See below for details.
City labels include Homestead (HST), radar site (AMX), Kendall (KEN), Coral Gables (COR), Miami (MIA), Miami Beach (MBC), Miami Shores (MSH), Hialeah (HIA), Pembroke Pines (PBP), Hollywood (HOL), Sunrise (SUN), Fort Lauderdale (FLL), and Boca Raton (BOC). Select sites are marked with a small dark red square: Miami Int'l Airport (north of COR), UMiami (south of COR), NWSFO/NHC (west of COR), and Fort Lauderdale Int'l Airport (south of FLL). Circular range rings are shown in green every 20 miles from the radar location. State, US, and interstate highways are drawn in gray; county lines in blue.

Source website

U.S. Storm Reports - Last 3 Hours

NWS Watch, Warning, Advisory Map

Convective/Tropical Weather Flooding Winter Weather Non-Precipitation
Tornado Watch
Tornado Warning*
Severe Thunderstorm Watch
Severe Thunderstorm Warning*
Hurricane Watch
Hurricane Warning
Tropical Storm Watch
Tropical Storm Warning
Flash Flood Watch
Flash Flood Warning*
Coastal/Flood Watch
Coastal/Flood Warning
Small Stream Flood Advisory
Blizzard Warning
Winter Storm Watch
Winter Storm Warning
Snow Advisory
Freezing Rain Advisory
Ice Storm Warning
Winter Weather Advisory
High Wind Warning or Advisory

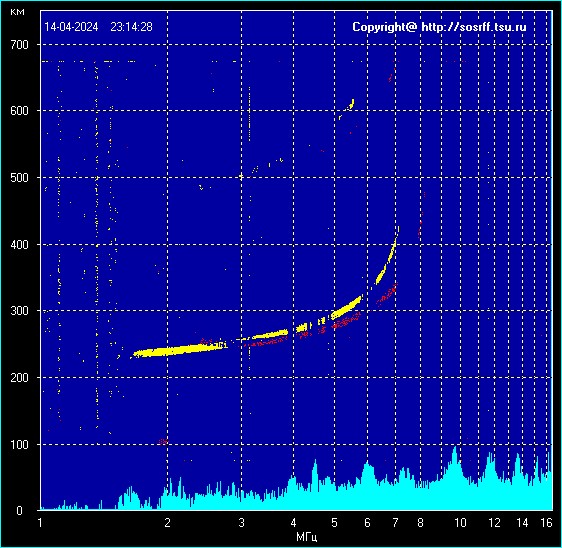
Realtime - Ionospheric data,last ionogram


Dependence of the amplitude of the sensed signal from the current frequency and acting elevation. Gradations of intensity amplitude of the upper right corner of the graph. Time ionogram corresponds Tomsk City(TLDV). TLDV = UTC +7

Realtime - Schumann resonances

The Schumann Resonances Power graph summarizes the information presented in the Spectrogram Calendar and illustrates the dynamic changes occurring in the Schumann Resonances region of the magnetic field. Power is the sum of the power in all frequencies detected by the site magnetometer from 0.32 to 36 Hertz and is calculated for every hour. A 24-hour moving average of this power data is plotted for each site and updated hourly.

Each monitoring site is represented by a separate colored line and can be toggled on or off by clicking the label for each site in the legend key. The time span of data displayed can be changed with the Zoom control in the upper left of the chart window or with the horizontal slider and range display controls under the time and date labels.

Realtime - The components of the magnetic field

The graphs show the depending variations the component of the magnetic field in the gammas at local time. Local time is expressed in hours of Tomsk summer daylight saving time (TLDV). TLDV = UTC +7. The following you can see the level of geomagnetic field perturbations in K-indices.

Realtime - GEOFON Global Seismic Monitor


Global seismicity located automatically using the GEOFON network. Only stations in and around Europe are currently used to locate events. Epicenter data and a detailed location map are displayed for the last "big" event. There is also a large version suitable for display on a 1280x1024